TeamViewer Monitoring provides early recognition of problems in your IT infrastructure and immediately alerts you when and where your attention is required. This helps you to keep an eye on the operational state of servers, workstations, and network devices – regardless of location - by monitoring aspects such as CPU usage, memory usage, and running processes/services. By staying on top of these alerts, you are able to run maintenance to resolve issues in record time.
This article applies to all TeamViewer Monitoring & Asset Management customers.
Monitoring alerts explained
TeamViewer Monitoring generates alerts when there is a risk of breaching a set threshold, which was defined in the assigned Monitoring Policy.
📄 Learn More about TeamViewer Monitoring policies
Different alert statuses are available:
💡Hint: For more information on the respective alert, click View in the alert box. This will open a drawer with details of the alert (e.g. when the alert was found, if it has been acknowledged and by whom etc.).
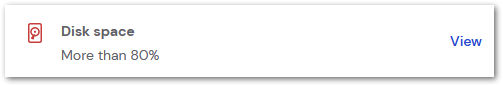
Detected Alert
When a set check is at risk of breaching its configured threshold, an alert is generated. The alert status appears as Detected and appears in red. Click View to see more information.
Acknowledged Alert
Once an alert is generated, it can be acknowledged by a user. This sets the alert status to Acknowledged.
📌Note: Acknowledging an alert does not mean the issue is resolved. It only means a supporter has seen and noted the alert, possibly to investigate it later (in cases of non-critical issues that do not require an immediate fix).
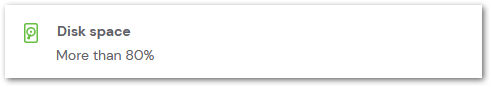
Resolved Alert
When the configured threshold of a set check returns to within its expected threshold, the alert will resolve automatically. The alert will return back to green to indicate a Resolved status.
💡Hint: The majority of Monitoring checks will attempt to verify and analyze if thresholds are breached or resolved every minute. If a time delay is set in the policy, however, the verification will happen based on that timeframe.
How to access TeamViewer Monitoring
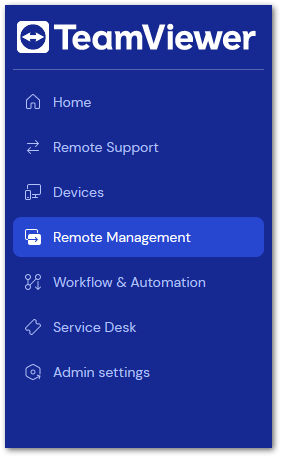
TeamViewer Monitoring can be accessed in TeamViewer Remote or the web app by clicking the Remote Management tab on the left-hand menu.
When accessing TeamViewer Monitoring, we recommend beginning on the Overview tab. This provides quick-access information that allows you to see what devices may need more immediate attention.
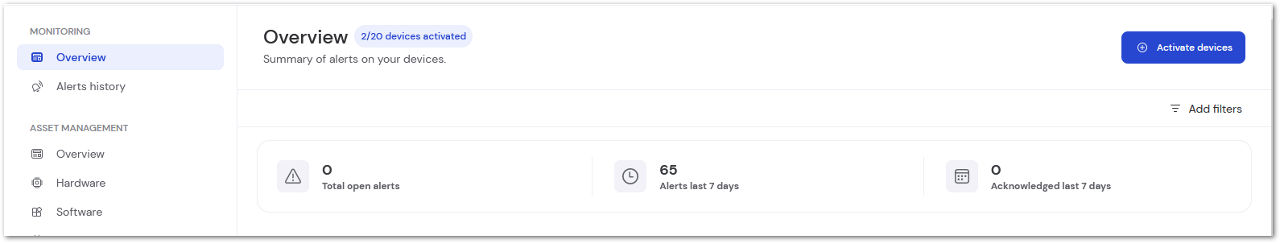
The following information can be found at the top of the Overview tab:
- Number of active vs available endpoints
- Total open alerts
- Amount of alerts in the past 7 days
- Amount of acknowledged alerts in the past 7 days
Below the alert summary are multiple graphs providing more visual data regarding the alerts.
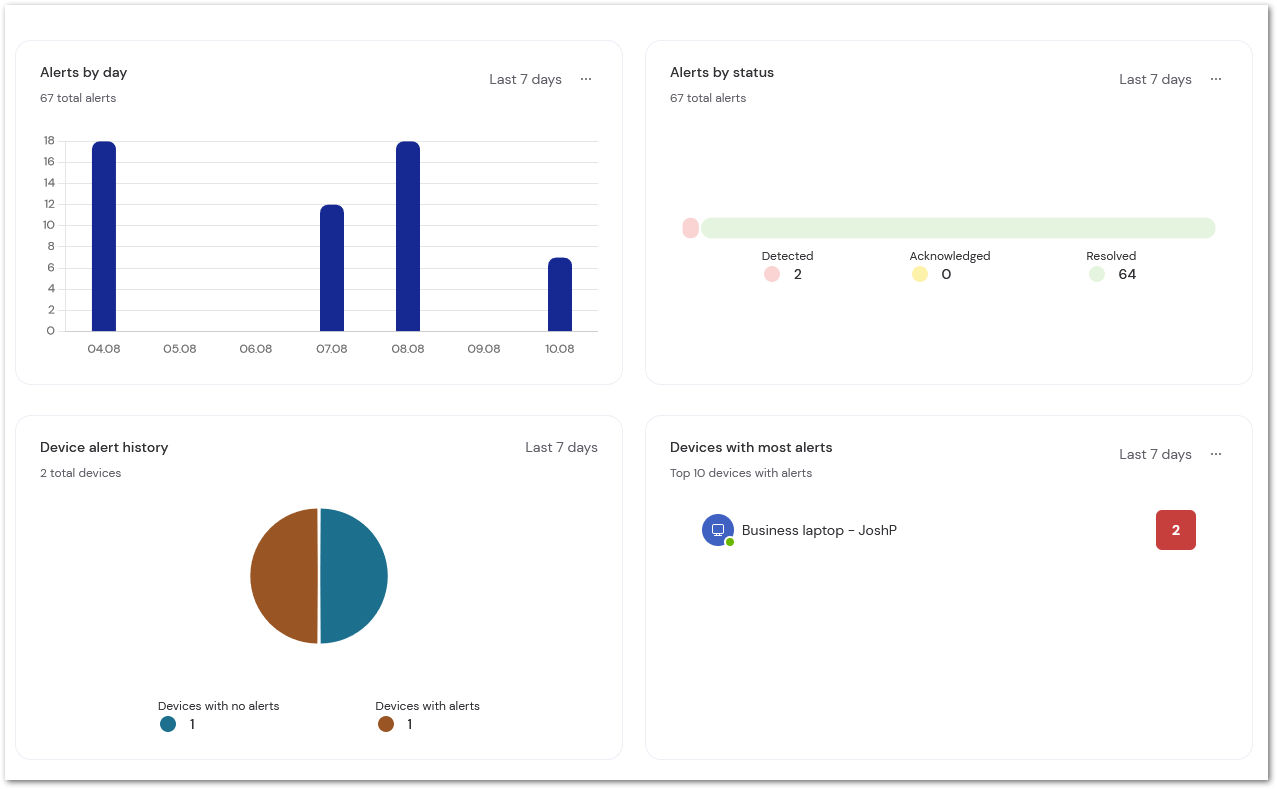
The graphs provide various information regarding the last 7 days:
- Alert summary by day
- Alert status summary
- Device alert history
- Top 10 devices with the most alerts
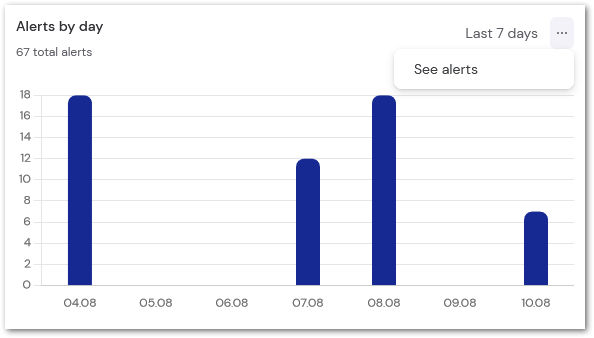
💡Hint: To go directly to the alerts, select the three-dot menu in the upper-right corner of the graph.
How to access the Alerts History
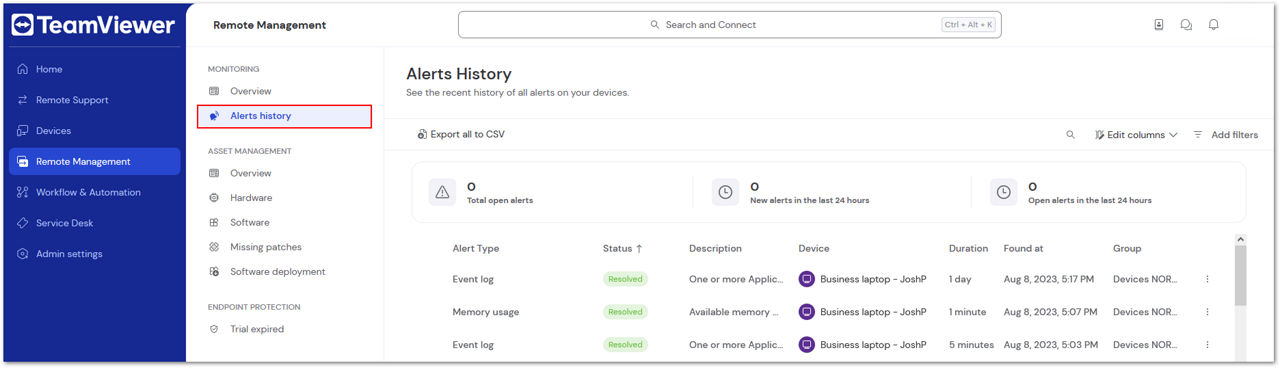
TeamViewer Monitoring's Alerts History is focused on incident response. All raised alerts (where the check threshold was breached) can be filtered, organized, and exported for further analysis.
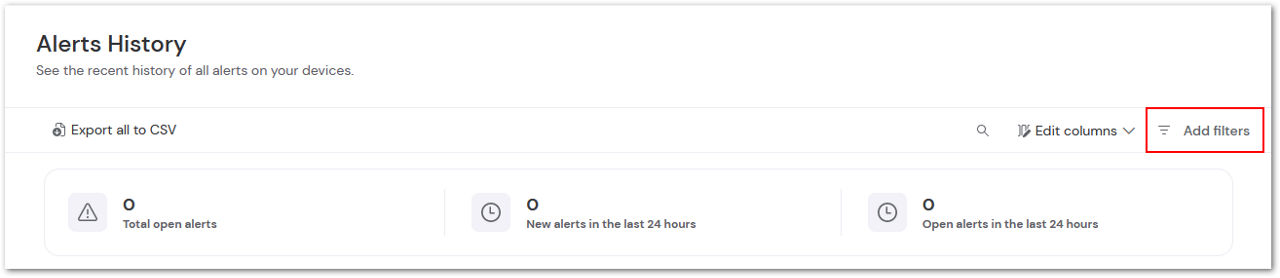
Alerts History shows a recent history of all alerts on devices. Admins get a first-hand overview of the amount of total open alerts, new alerts in the last 24 hours, and open alerts in the last 24 hours.
Alerts History can be accessed within TeamViewer Remote or the web app by clicking Alerts History on the left-hand menu.
Filtering Alerts
TeamViewer Monitoring allows the filtration of alerts, enabling the user to get a comprehensive view based on their current needs. Filters can be created by clicking + Add Filters in the upper right corner.
TeamViewer Monitoring offers the following filter options:
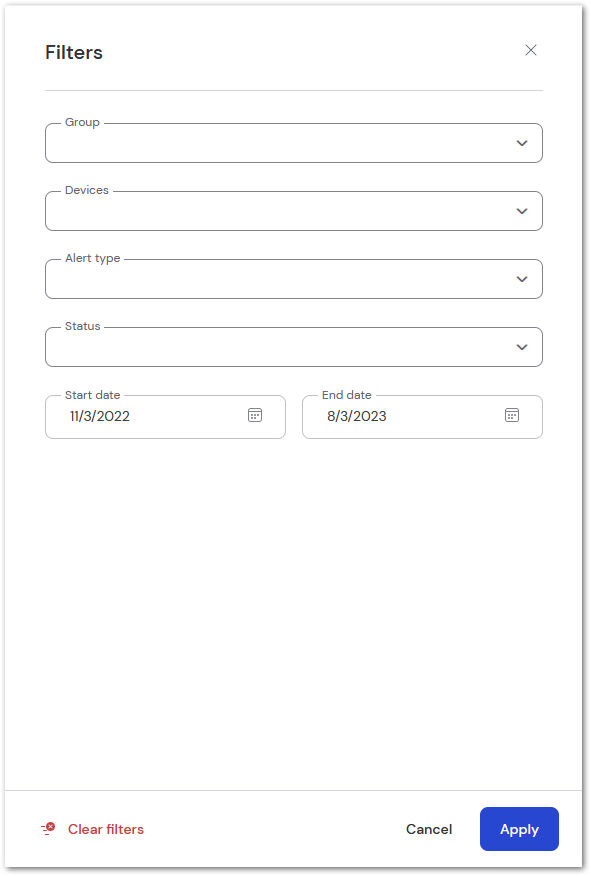
- Filter by group
- Filter by device
- Filter by Alert type
- Filter by Alert status
- Filter by Date range
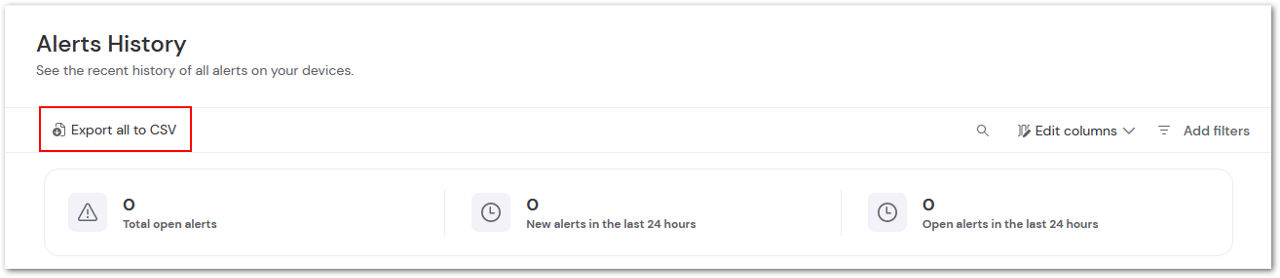
It is also possible to generate an export of the overview as a CSV file. Click Export all to CSV to begin the export
How to set up notifications
TeamViewer Monitoring provides the ability to receive email notifications to any member of your Company Profile, as well as push notifications to their mobile device. An email is sent for the Detected alert as well as the Resolved alert (for the same check). Notifications are set up in the Monitoring Policy.
📄Learn More about Monitoring Policies
💡Hint: Notifications are check-specific, meaning different users can be alerted in cases of different situations.
Email Notification
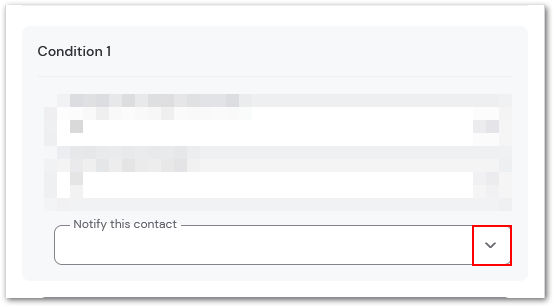
When setting a check within the TeamViewer Monitoring policy, a field for Notify this contact appears at the bottom of the requested check. Select the desired recipient from the drop-down that appears here.
📌Note: Only TeamViewer accounts that are a part of the same Company Profile can receive TeamViewer Monitoring alerts
Push Notifications
Along with email notifications, users can be notified via push notifications to a mobile device. This requires the mobile version of TeamViewer Remote Control to be installed on the desired device.
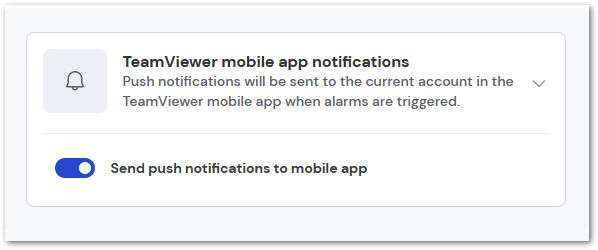
When activated, the mobile device the supporter is logged into will receive push notifications whenever an alarm is triggered
📌Note: Push notifications will be sent to the TeamViewer account selected for each alert. Please also ensure that notifications are allowed for the TeamViewer Remote Control app
How to access the Remote Task Manager
📌Note: Remote Task Manager is only available for Windows OS devices
The Remote Task Manager is a feature of TeamViewer Monitoring & Asset Management that allows you to access the list of current processes and services on any Windows endpoint. Processes and services can be terminated/restarted directly from TeamViewer.
The Remote Task Manager can be accessed from TeamViewer Remote or the web app.
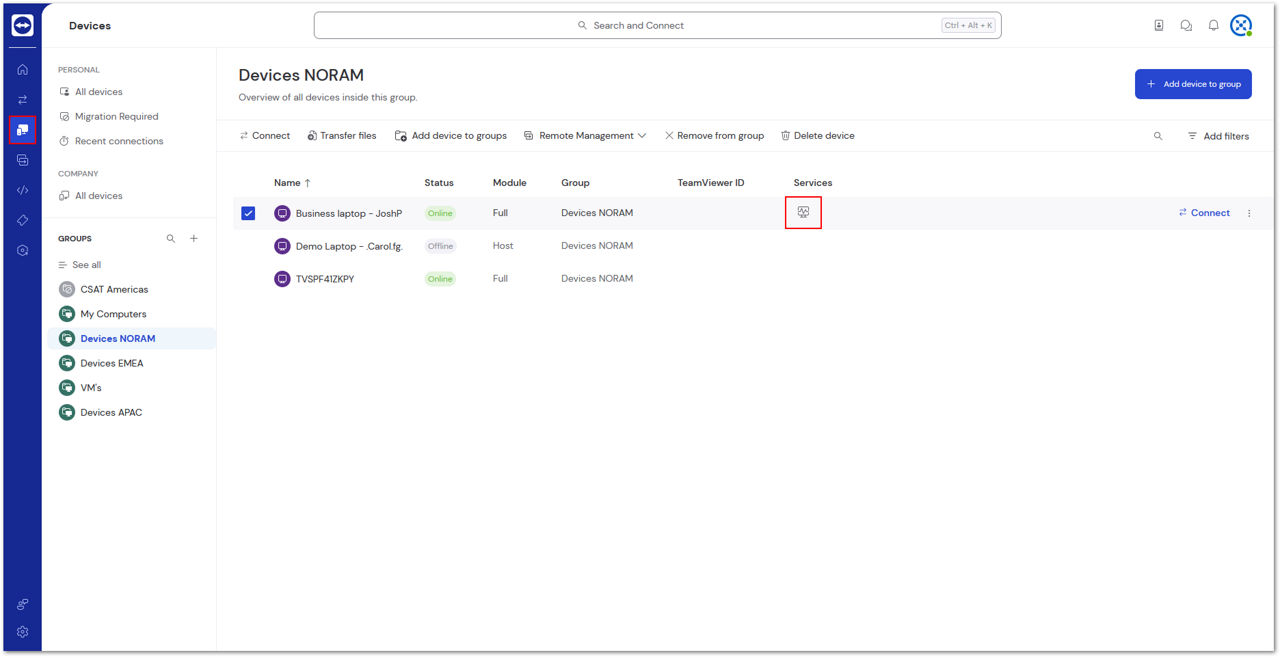
Step 1
Open the device drawer by clicking the Devices icon on the left-hand menu. Click the Monitoring icon to the right of the device name.
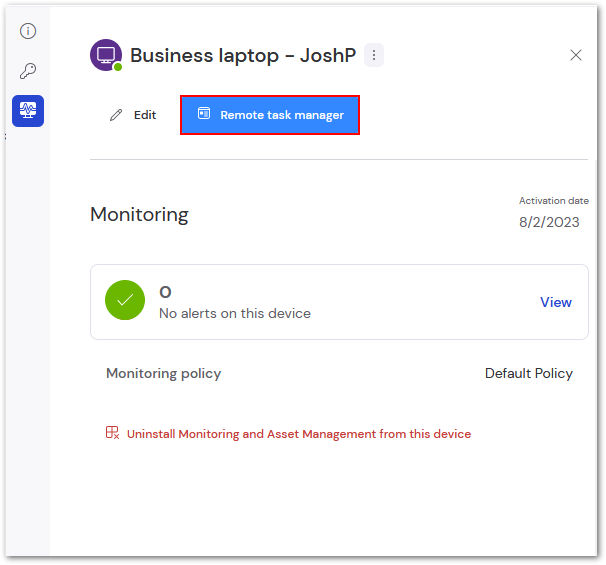
Step 2
Select Remote Task Manager at the top of the Monitoring drawer.
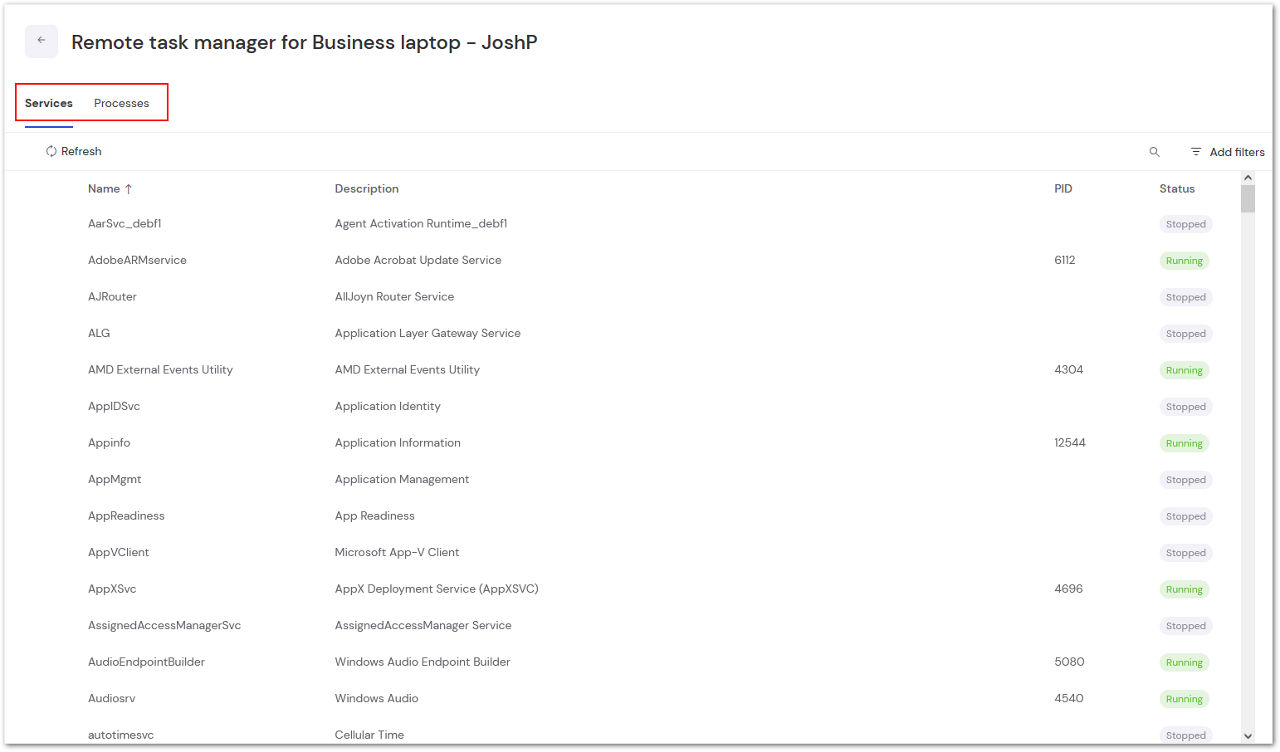
Step 3
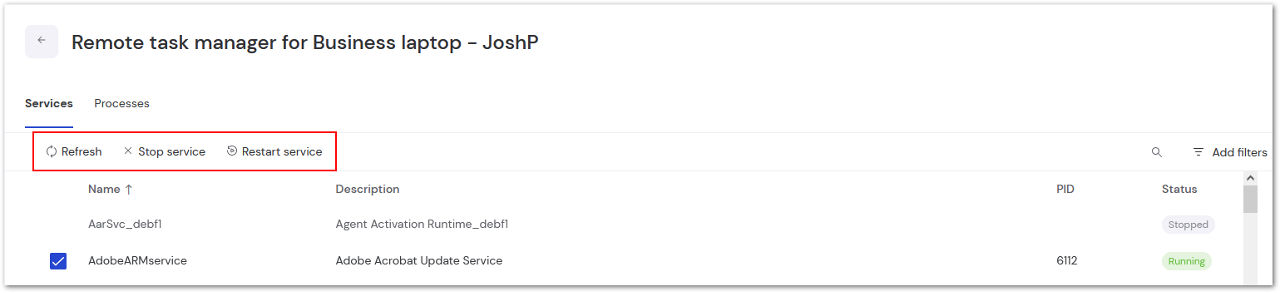
TeamViewer Monitoring will now show all active services and processes. Select between service and processes at the top.
Step 4
Check the box to the left of the desired service/process. Select Refresh, Stop service, or Restart service at the top of the window.