Navigation path: Reports
Summary
Purpose
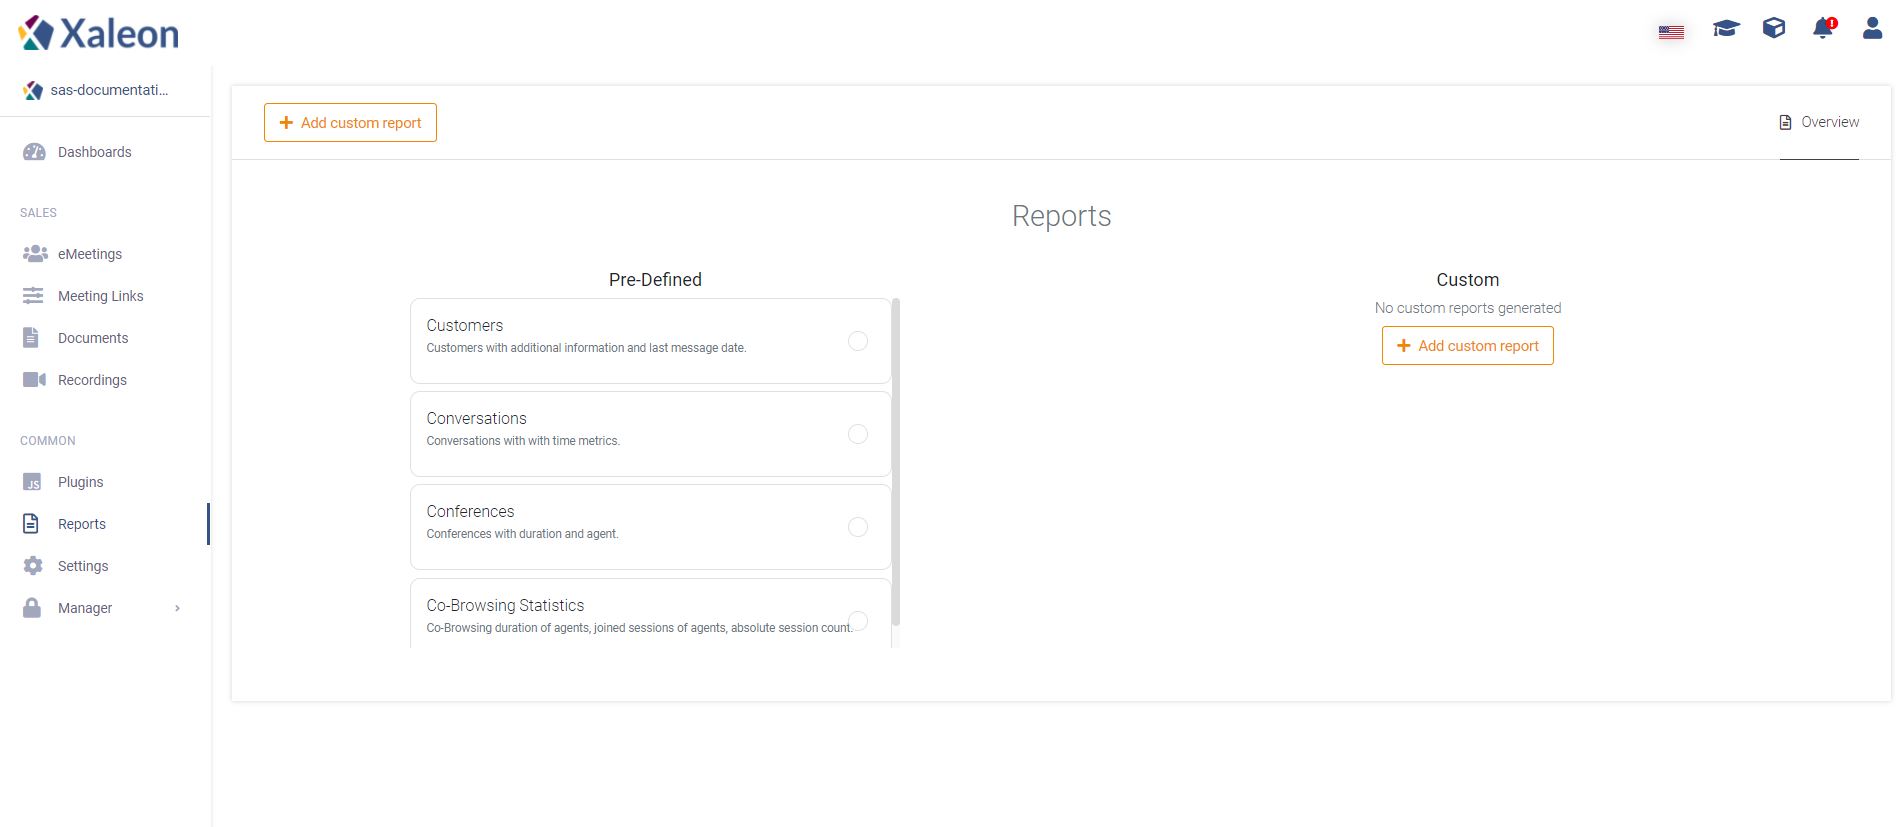
Reports allow you to export Pre-Defined and Custom Reports to see statistics of your TeamViewer Engage usage for a selected period of time.
Feature descriptions
Reports can either be Pre-Defined or Custom. When using Custom-Reports, you can choose which columns should be added to the report.
Your first Report
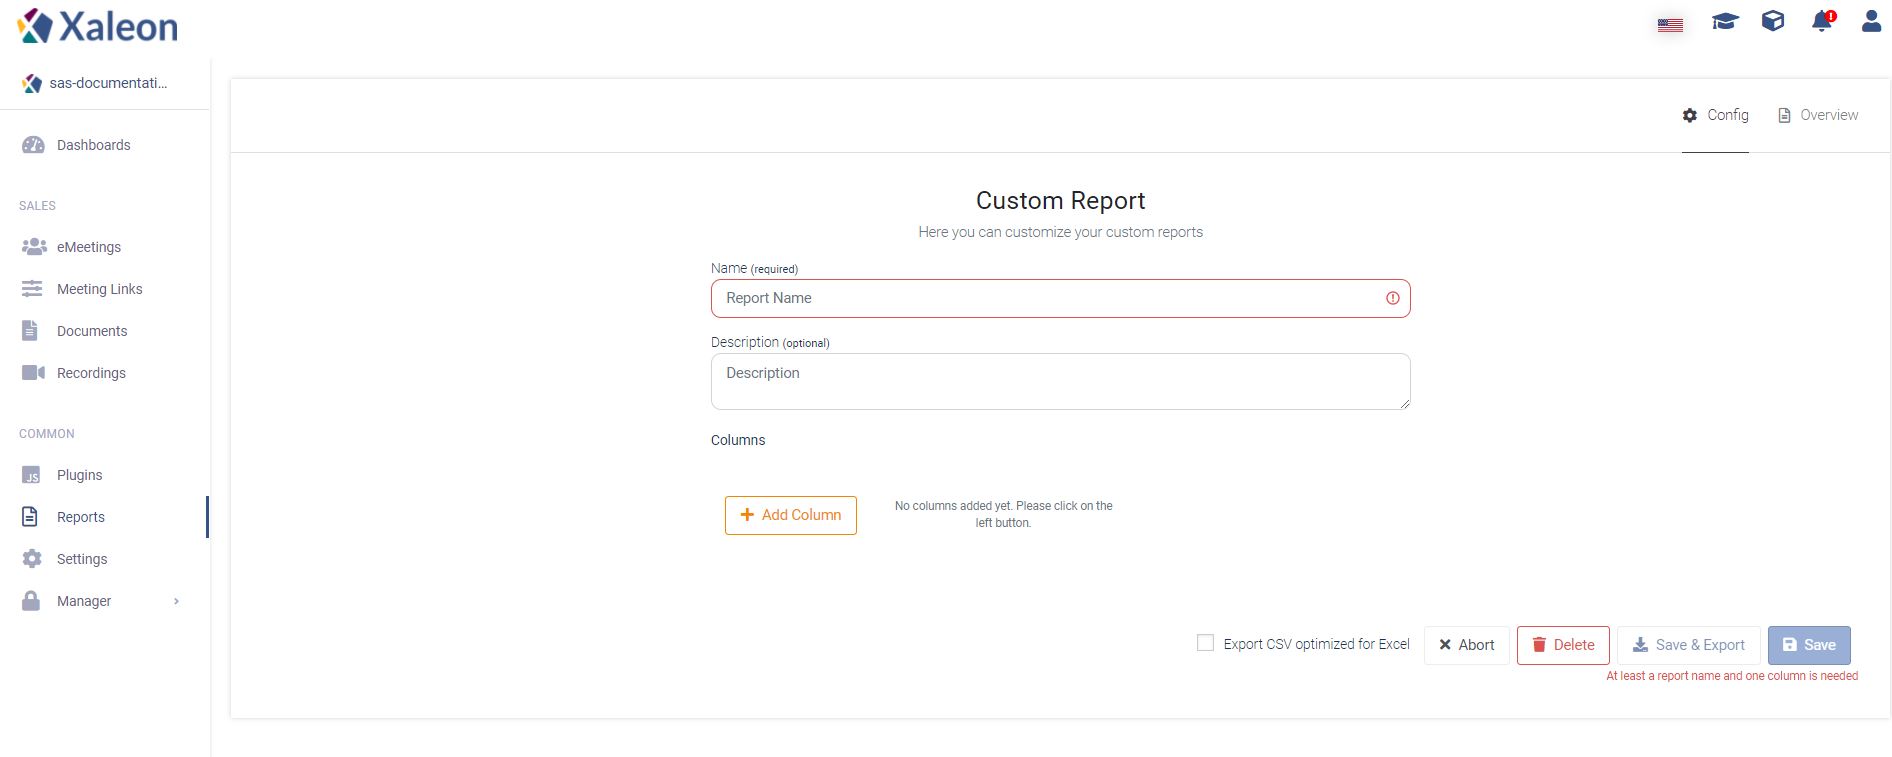
To create your first Report click + Add custom report. As a first step, make sure you give your report a descriptive name.
You can add an optional description to the report.
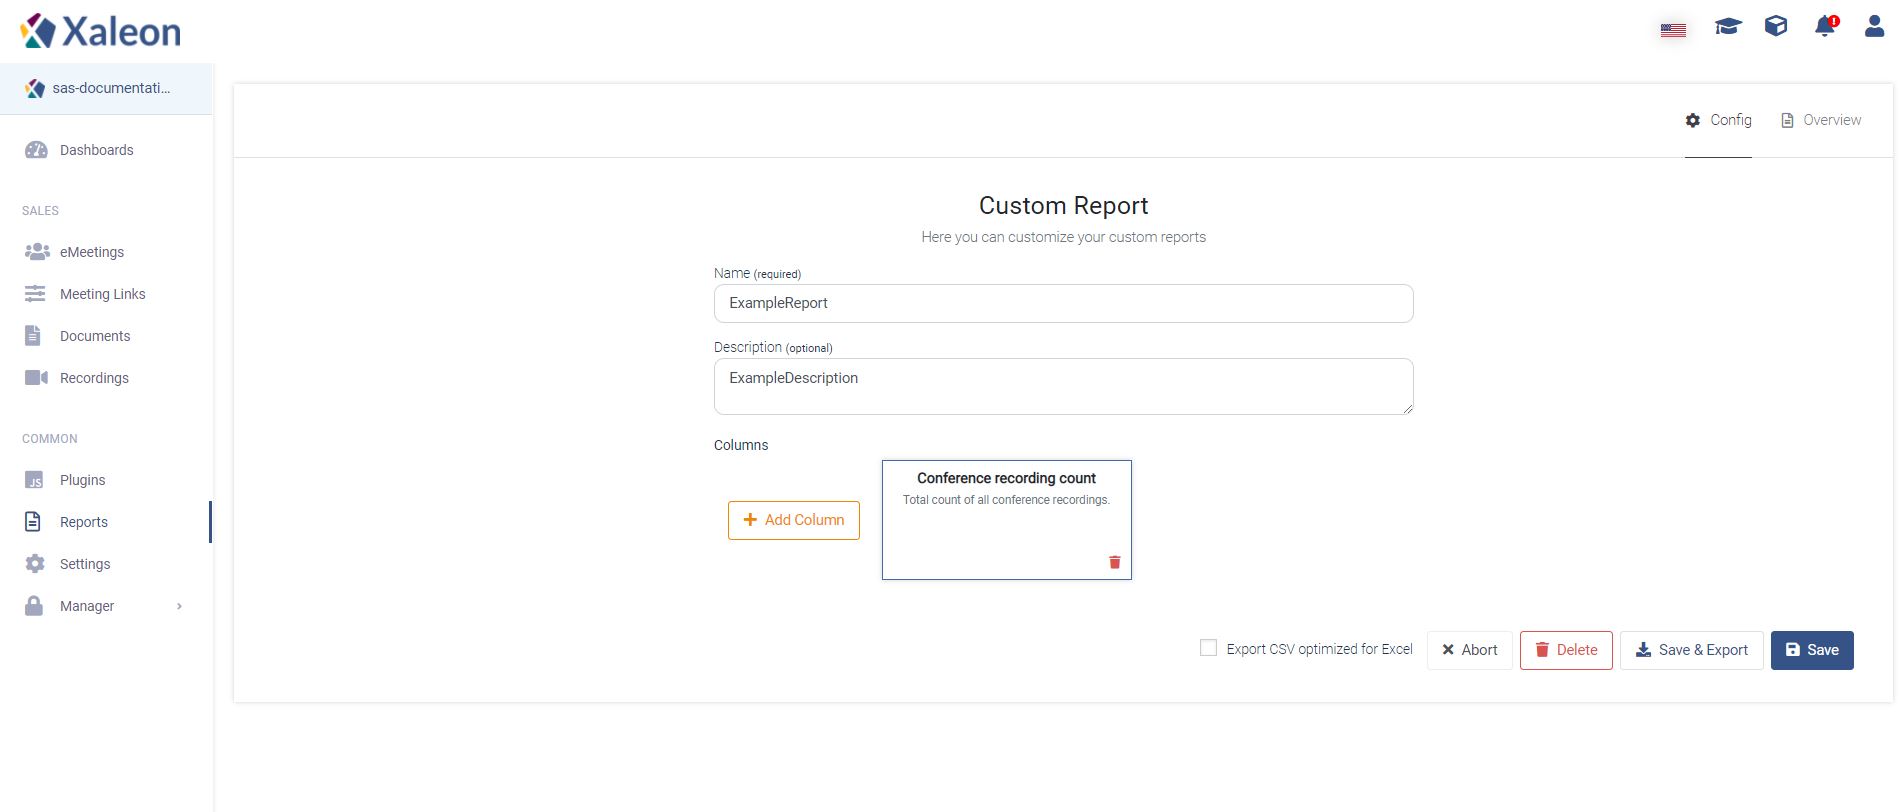
To add a column to your Report click + Add Column. Then you have to select the following categories:
- Area to limit the data area
- Data Source to select the specific variable you want to display
- Sometimes you have to select the Unit the variable will be displayed in
📌Note: El orden de las columnas se puede cambiar arrastrando y soltando.
Después de seleccionar las columnas, puedes hacer clic en Save para guardas el informe personalizado para posteriores usos oSave & Export para exportarlo directamente. Cuando lo exportes hay que seleccionar el período de tiempo primero.