Note: Picking KPIs is not available by default. To enable this feature activated please contact your Customer Success Manager.
xPick is used for managing and assigning picking orders to Frontline Workers.
xPick Dashboard, located in the Picking KPI section, provides data visualization in order picking scenarios for warehouse managers or supervisors regarding inventory management and labor management to create a potential for process optimization and efficiency increase. This Dashboard consists of three sections:
- KPI Overview
- Overall Picking Performance
- Average Process Composition
Note: With the Refresh dashboard filter, you can adjust the refresh cycle by a set time interval.
KPI Overview
The KPI overview section helps you monitor executed orders, picked items, and exceptions. Each KPI is split into a daily, weekly, and monthly timeframe with the ability to compare numbers to a previous cycle. You can identify positive and negative trends easily by red and green highlighting.

Overall Picking Performance
This section allows you to monitor order details, exceptions, and the number of active pickers over time.
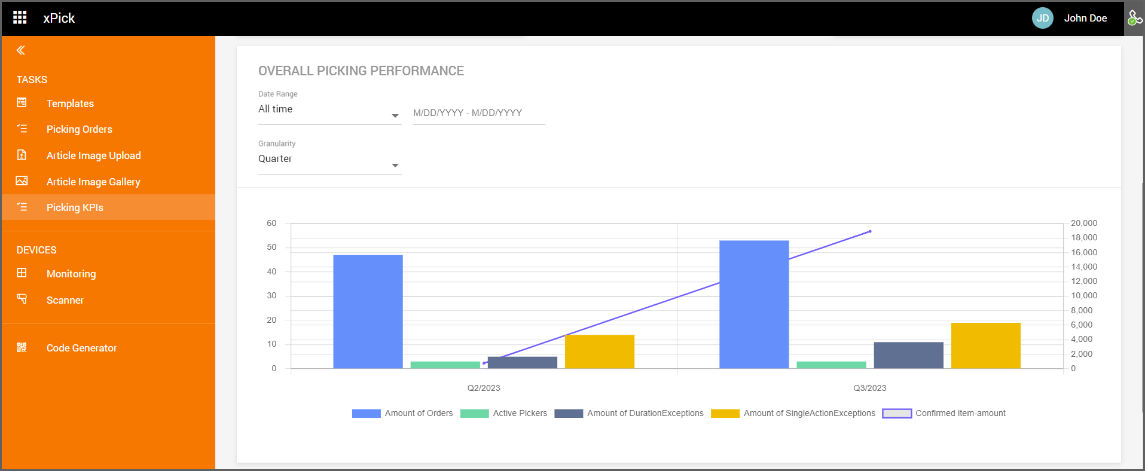
It enables you to monitor the following metrics:
- Amount of Orders: Shows the number of orders within the determined time period
- Active Pickers: Shows the number of active pickers within the determined time period
- Amount of Duration Exceptions: Shows the exceptions that take more than 5 seconds
- Amount of single Action Exceptions: Shows the exceptions that take less than 5 seconds
- Confirmed item-amount: Shows the number of confirmed items
There are two types of filtering options:
- With the Date Range filter, you can filter the charts to view the data over all time, for the last week, last month, last quarter, last year, or a customizable time period.
- With the Granularity filter, that affects the time axis on the chart, you can filter the data to no grouping, day, week, month, quarter, or year. This filter can also filter the data to an hour but only for the last 1 - 2 weeks. Otherwise, this option is greyed out.
Note: With a click on the items in the legend, you can toggle on or off the metrics.
Average Process Composition
The Average Process Composition section shows what proportion do the steps take in the overall process.

It enables you to monitor the following activities:
- Pre-Order Request time: Shows the time period of activities done before the workflow starts
- Preparation duration: Shows the time period of activities after the start of the workflow but before the start of the order
- Net Picking time: Shows the validation time of items picked and single action exceptions
- Post-Order actions duration: Shows the time period of activities between the validation of all items and the start of the next order
- Duration of Duration Exceptions: Shows the exceptions that take more than 5 seconds of actions on the user’s side
There are two types of filtering options:
- With the Date Range filter, you can filter the charts to view the data over all time, for the last week, last month, last quarter, last year, or a customizable time period.
- With the additional Include Net Picking-time checkbox on the top right corner of the section, you can include or exclude the net picking time on the charts.
Note: With a click on the items in the legend, you can toggle on or off the metrics.