The TeamViewer Embedded Agent comes with a pre-configured monitor for monitoring the operating system of your Edge Device. This is helpful to monitor the status and the health of your devices.
You can use this feature to keep track of the following device operating system metrics:
- 1 min load
- 5 min load
- 15 min load
- Free Memory
- Total Memory
- Free Swap Memory
- Total Swap Memory
- Buffers Memory
- Cached Memory
- Number of CPU cores
- User CPU Usage
- Nice CPU Usage
- System CPU Usage
- Idle CPU Usage
- Io Wait CPU Usage
What you will need
Make sure that you have prepared the following points:
- Your TeamViewer credentials.
- The edge device is set up with a TeamViewer Embedded Agent and TeamViewer Edge Management is enabled.
- The edge device is connected to the internet.
Setup
1. To log in to the Embedded Management Console, open https://iot.teamviewer.com/ and use your TeamViewer account credentials.
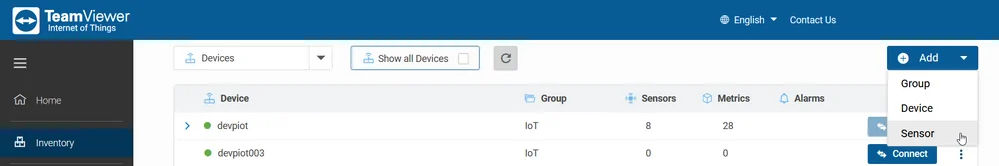
2. From the left menu select Inventory.
3. On the right side from the dropdown menu Add select Sensor.
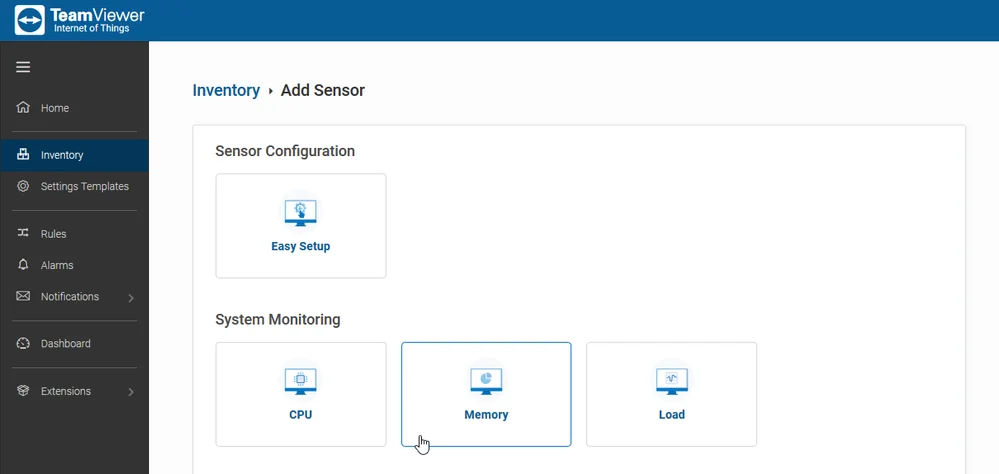
4. Depending on which data you want to monitor, activate CPU, Memory or Load.
5. From the dropdown menu Select Device select the Edge Device you want to monitor. The Sensor Name will be generated automatically with the selected option.
6. Select the frequency by which the data will be sent to the TeamViewer Embedded Cloud. It can be defined in seconds or minutes.
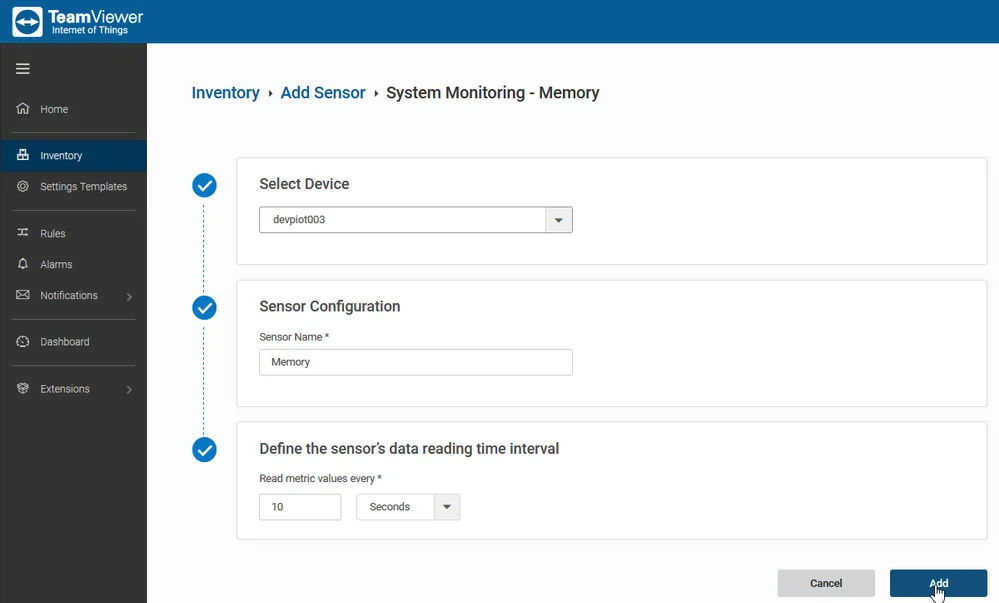
7. To finish click Add. You will be redirected automatically to the Inventory.
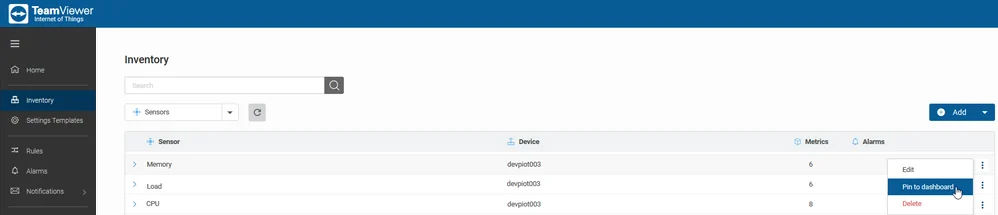
8. From the list choose the Sensor you want to monitor, then from the dropdown menu select Pin to Dashboard.
You can use Rules and Notifications if you want to receive a notification when the health of your Edge Device is in danger. For example: receive a warning if the CPU usage is above 90%.