TeamViewer Embedded comes with a pre-configured monitor for monitoring the operating system of your Edge Device. You can use this feature to keep track of the following device operating system metrics:
- 1 min load
- 5 min load
- 15 min load
- Free Memory
- Total Memory
- Free Swap Memory
- Total Swap Memory
- Buffers Memory
- Cached Memory
- Number of CPU cores
- User CPU Usage
- Nice CPU Usage
- System CPU Usage
- Idle CPU Usage
- Io Wait CPU Usage
This article applies to all TeamViewer Embedded users and requires TeamViewer Embedded Agent 2.8.14 or higher.
How to Setup
Login in TeamViewer Embedded Management Console
From navigation panel click on Inventory and from the ADD dropdown menu on the right select Add Sensor.
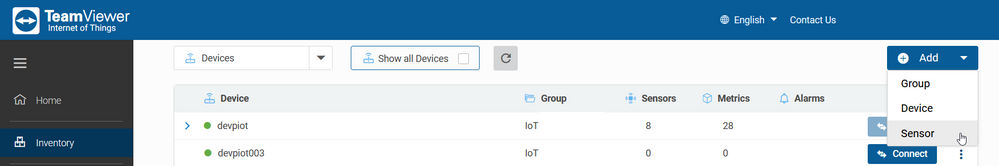
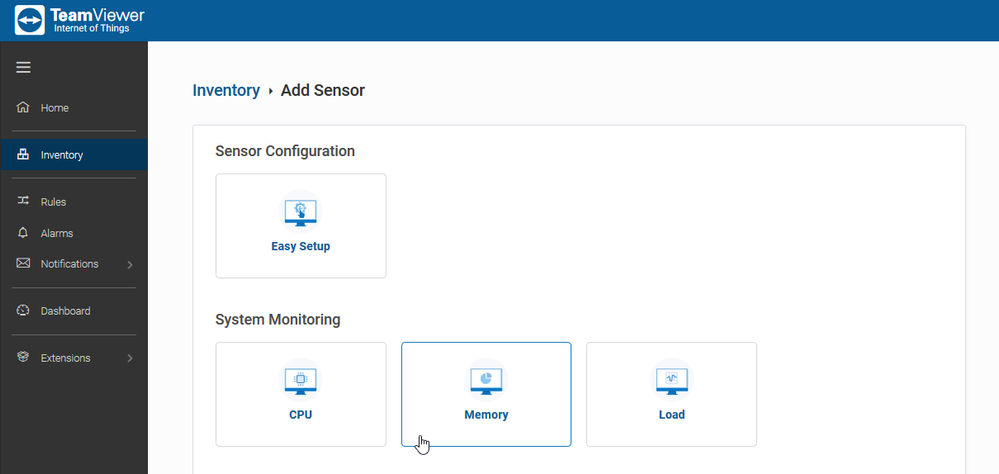
Depending of which data you want to monitor, select CPU, Memory or Load.
You can activate all the three sensors on your device.
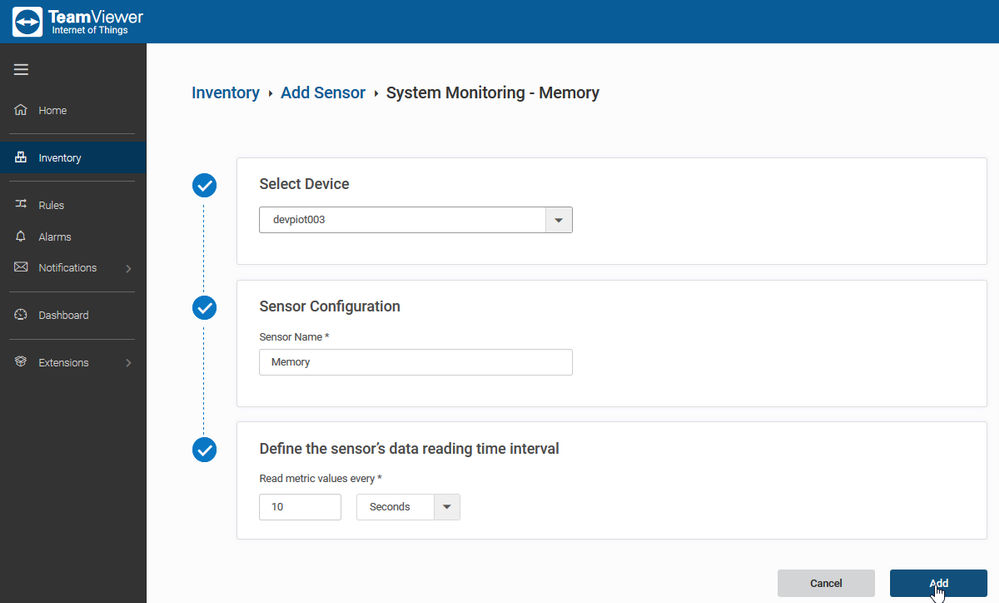
After, you need to Select Device from the dropdown menu.
The Sensor Name field will be automatically generated with the selected option. Also, it is possible to input the desired name.
Next, select the frequency by which the data will be read. It can be defined in seconds or minutes.
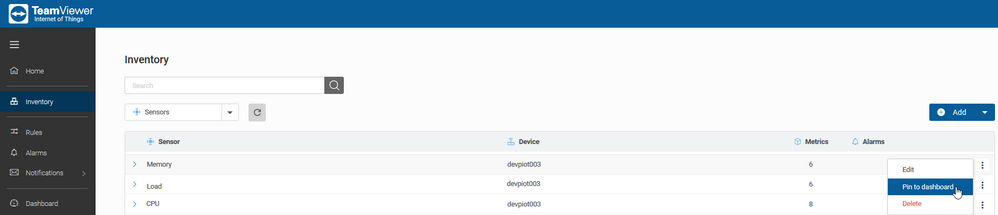
After you clicked on ADD, you will be automatically redirected In the Inventory menu.
Scroll down and select the Sensor that you just created and pin to you Dashboard.
To disable it, just select the desired Sensor and from the right menu, click on Delete.