This article applies to TeamViewer Servicecamp customers.
With a new reporting functionality in Servicecamp IT technicians can efficiently manage their workloads and create reports for great insights.
Servicecamp is offering two types of reporting:
- The first one is to get reporting data in analytics tools like Power Bi or Tableau and build your own reports based on raw data.
- The second type of reports are Servicecamp build-in reports that can give a clear picture of the situation without any effort.
Both reporting methods allow monitoring daily ticket activity, agent efficiency, average resolution times, and so on.
Reports
In order to see your reports, go to the Servicecamp dashboard and click on Reports link at the bottom part of the left menu.
Currently four types of build-in reports are available in Servicecamp.
- Ticket Activity - Shows created and closed tickets comparison alongside to backlog tickets.
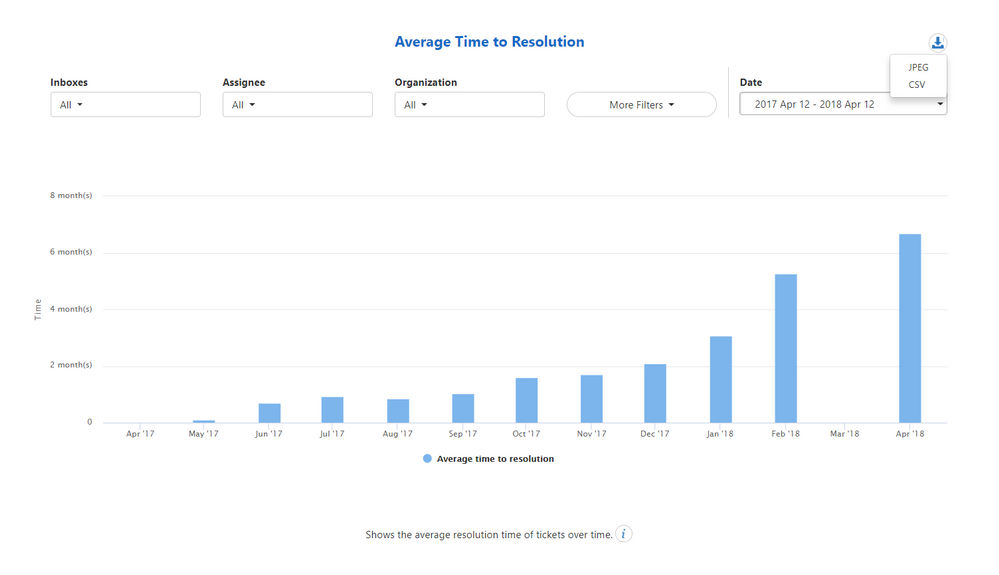
- Average Time to Resolution - Shows the average resolution time of tickets over time.
- Agent Activity - Shows number of tickets per staff agent.
- User Activity - Shows number of created tickets per customer.
For all above mentioned reports the below functionalities are available.
- Filter reports based on tickets metadata.
- By hovering mouse to chart point of graph see metrics data for reporting interval.
- Export reports data in CSV and chart image in JPEG formats.
- See detailed information about report by clicking on information icon at the bottom of each report.
Ticket Activity
Ticket Activity shows created and closed tickets numbers in comparison to the number of backlog tickets for selected reporting period.
This report gives the understanding on how many tickets were created or closed on daily, monthly, or yearly basis. One glance will be enough to understand that something has happened if the created ticket count dramatically increases or gets down.
Created tickets: New created tickets count on that day.
Closed tickets: Closed tickets count on that day. At each day of reporting period show tickets count which status at the end of day was closed.
Backlog: Lists all tickets which are not in status closed or deleted on that day.
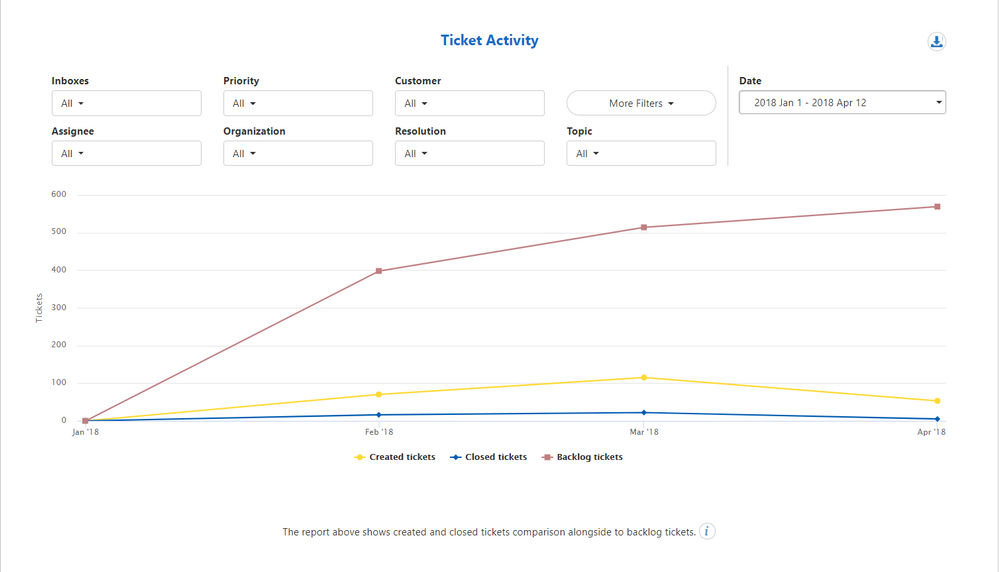
By hovering the mouse to the chart point on the graph, the metrics numbers for reporting intervals will be displayed. Reports also allow disabling graph charts by clicking on the necessary legend at the bottom of the report and having a detailed view of other charts.
The below filters that are tickets metadata allows to filter and drill down reporting data. Multi-selection filters are supported which means that for one filter it's possible to select more than one value.
- Inboxes
- Priority
- Customer
- Assignee
- Organization
- Resolution
- Topic
- Date
Average Time to Resolution
Average Resolution time is the time between the ticket creation time and the time of the final (or most recent) change of status to closed for a given reporting period.
Deleted tickets information is not counted in the report.
For experienced managers, this report is a must-have tool that allows monitoring the resolution time of tickets for specific customers or organizations or tracking agent efficiency by monitoring the average resolution time of tickets that were assigned to them.
Below filters are available for this report
- Inboxes
- Assignee
- Organization
- Customer
- Priority
- Topic
- Resolution
- Date
Servicecamp is also offering functionality to export report data in CSV format or export chart image in JPEG format which is required feature for people who need to sent reports to their managers or supervisors.
Agent Activity
Shows number of tickets that were created during the given reporting period and are currently assigned to staff agent, additionally showing the number of tickets that are currently unassigned.
Another powerful tool to measure agent performance is by checking how many tickets were assigned to agents and how many were closed for a given reporting period.
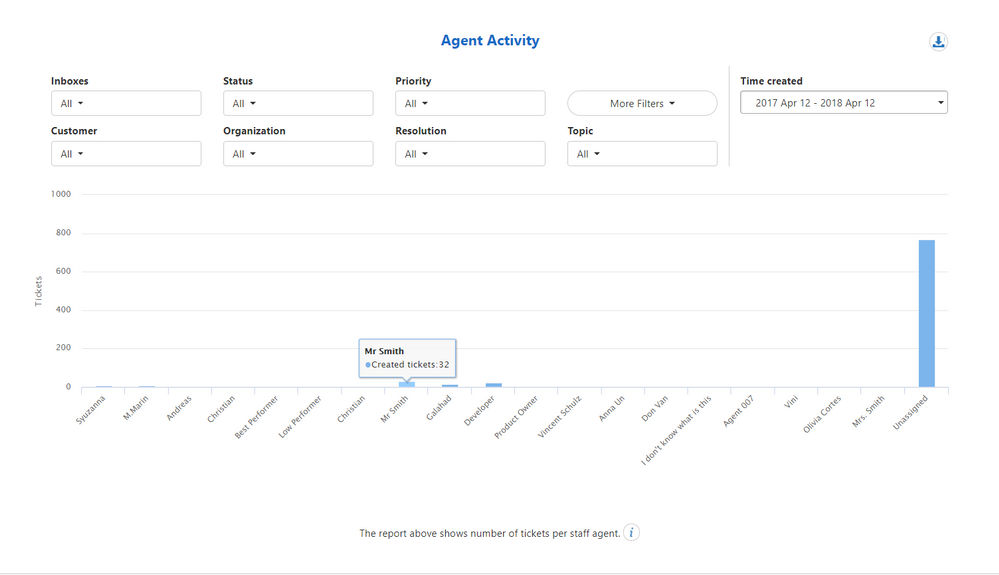
By hovering the mouse to chart point on the graph, the metrics numbers for reporting interval will be displayed.
Below filters are available for this report
- Inboxes
- Status
- Priority
- Customer
- Organization
- Resolution
- TopicTime created
User Activity
Shows number of tickets that were created by customers for the given time period. By default Top 15 customers with the highest count of tickets will be shown.
Another must have tool to monitor activity of users, on how many tickets were opened per customer or organization, in what period and with what priority.
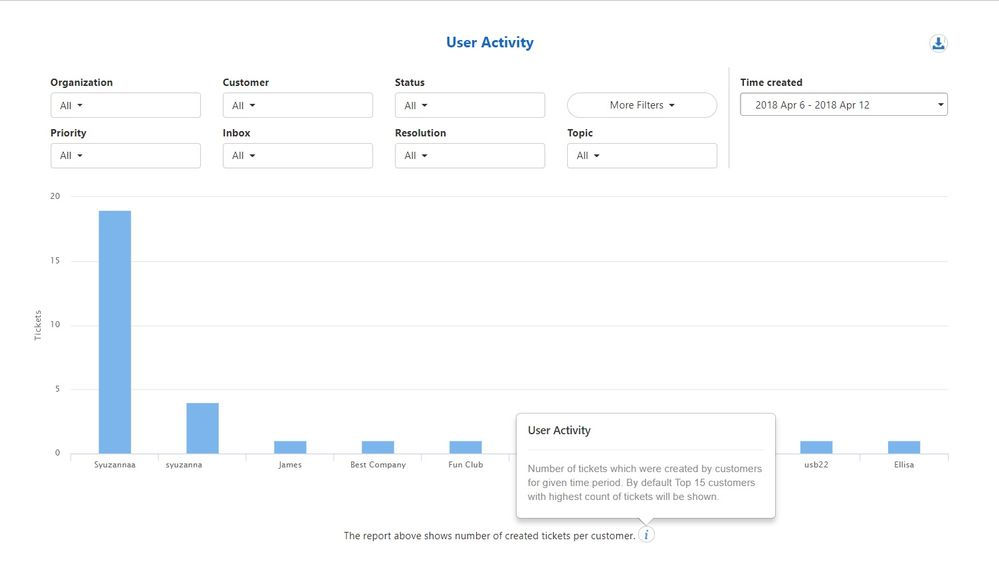
See detailed information about the report by clicking on the information icon at the bottom of each report.
Below filters are available for this report
- Organization
- Customer
- Status
- Priority
- Inbox
- Resolution
- Topic
- Time created