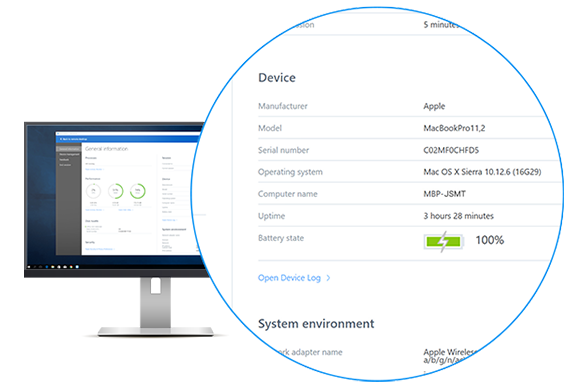
Get More Info From the Extended Remote Device Dashboard

Find even more accumulated spec information all in one window within TeamViewer 13’s Extended Remote Device Dashboard!
While taking care of troublesome computing devices, supporters oftentimes depend on information about the system hardware and software, as well as performance to expose sources of errors or when choosing an adequate solution.
Until recently, you were forced to collect that information piece by piece from different places and menus time and time again, which is just unnecessarily repetitious.
In many cases, finding out what you need to know is connected to running typed commands, or a lot of clicking through menus and sub-menus.
Because it’s not as if there was a single page provided by the operating system that shows all the data with relevancy to troubleshooting common problems.
Oh wait, that feature is actually provided by TeamViewer 13 and it’s called the Extended Remote Device Dashboard!
What’s New in TeamViewer 13’s Extended Remote Device Dashboard?
Thanks to your feedback, we implemented five additional entries into the Remote Device Dashboard with the latest TeamViewer version:
S.M.A.R.T. Information
For the majority of PC users, disk drives remain the main storage location for their data to this day. And because the surprising loss of a drive with all its data can be devastating, checking on its health state every once in a while is more than advisable.
The S.M.A.R.T. Information panel allows you to check the health states of disk drives in the blink of an eye, listing all disk drives connected to the device with a basic health state rating.
It utilizes information the S.M.A.R.T. (Self-Monitoring, Analysis, and Reporting Technology) feature of the drive disks usually provide and displays them directly within the Remote Device Dashboard, saving you the detour via Windows’ Command Prompt or macOS’s Utilities.
Battery State
Does the device’s battery drain unusually quickly? Or is it going to be a longer repair job and you want to check if the device is being charged?
Take a look at the section Device, Battery State.
Here, the device’s battery state is being displayed and, if available, shows the battery’s charge in percent and whether it’s being charged or discharged at the moment.
BIOS Information
A system’s BIOS rarely needs an update, but when it does, extreme caution is advised.
If the wrong BIOS is installed, the motherboard can suffer major malfunctions. That’s why the BIOS should only be updated, if it’s really necessary.
Under Device, BIOS Version/Date, you can take a closer look at the motherboard’s current BIOS to decide on your favored course of action.
Event Log
This is a direct link to open the device’s event log.
If you need to know precisely when an error occurred and what the source of it was, this is your place to go.
Uptime
Did you plug it out and back in again?
Some people tend to never shut down their device, whereas a reboot can be a quick fix for many smaller problems.
Now you can check how long it has been since the last reboot of a device at a glance.
Get All the Info to Work as Effectively as Possible
With the additional information provided in the Extended Remote Device Dashboard, we want to help making remote support workflows more simple and effective.
It offers so much info in a single place and it is only one click away, as soon as a remote connection is established. As a result, you won’t have to waste any time getting that information, but you can start resolving the problem straightaway!
How much time do you think the Extended Remote Device Dashboard will save you on an average support case? Share your thoughts in the comment section below!
Former Community Manager
